


Narangba House Prices Push Above $1 Million as Market Holds Firm

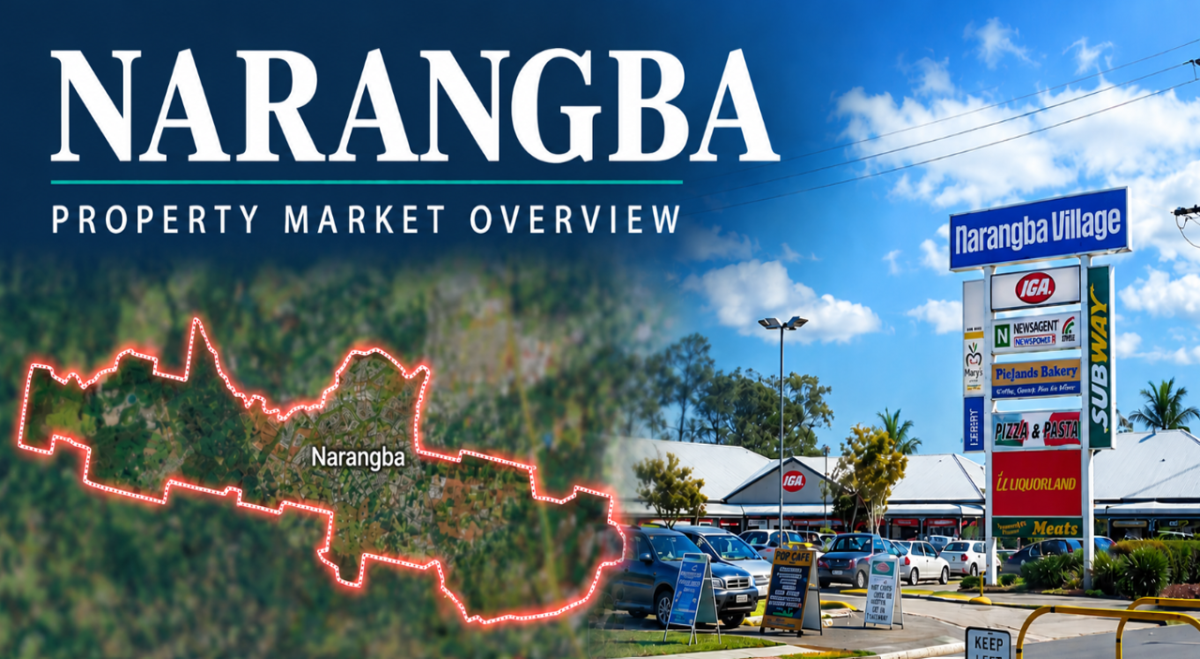
Narangba’s house market has pushed firmly into seven figures, with the latest three-month median reaching $1.045 million as sales through winter continued to cluster around the million-dollar mark.

The latest Narangba Property Market Overview, covering transaction data to 3 September 2026, puts the three-month house median about 3.9 per cent above the 12-month median of $1.0055 million.

There was also reasonable depth behind the latest snapshot. The dataset contains 80 house transactions over the three-month period, including 78 with usable prices for the median calculation, plus six unit transactions. That takes total residential transaction volume to 86.

Recent monthly results also show the suburb repeatedly trading around the million-dollar level rather than relying on a single strong month.

3-Month House Median

$1,045,000

+3.9% vs 12-month median

3-Month Unit Median

$815,000

0.0% vs 12-month median

3-Month Residential Volume

86 sales

80 houses + 6 units

Median Days to Sell

34 days

Houses; units recorded 28 days

House Market Settles Into Seven Figures

The monthly figures still move around, but the broader direction is clearer than any one result.

House medians were $950,000 in October 2025 and $980,000 in November before moving above $1 million in January 2026. The monthly median reached $1.1475 million in May, then eased to $1.035 million in June before returning to $1.055 million in July and $1.06 million in August.

September’s preliminary figure is lower at $949,000, but it needs to be treated with particular caution. The analysis only runs to 3 September and the figure is based on three qualifying sales, making it a partial-month observation rather than evidence of a broader market shift.

Narangba Houses — Monthly Median Price

The three-month median smooths some of that month-to-month movement and leaves Narangba at $1.045 million.

Selling times have also lengthened in the latest period. Within the PMO dataset, the three-month median for houses was 34 days, compared with 14 days across the 12-month analysis.

Four-Bedroom Homes Dominate Narangba Sales

The make-up of recent sales helps show where most of the activity has been concentrated.

Among house transactions with usable bedroom information, four-bedroom homes accounted for 53 sales during the three-month period. There were another 10 five-bedroom sales and nine three-bedroom sales.

That makes four-bedroom homes clearly the most common configuration in the available bedroom data, which fits Narangba’s strong family-home profile without implying that every transaction falls into the same price bracket.

There was also activity at the upper end.

The highest-priced transaction recorded in the overview was 94 Bazeridge Drive at $2.06 million, a five-bedroom, two-bathroom house attributed in the dataset to Tyson Von Hoff.

It was followed by a $1.518 million transaction at 6 Feeder Street and a $1.46 million house sale at 1257 Oakey Flat Road. Three other houses in the Top 10 changed hands for $1.45 million or more.

A Much Smaller Unit Market

Narangba’s unit market is considerably thinner, which makes the figures more sensitive to individual transactions.

The three-month unit median was $815,000, exactly level with the 12-month median. However, only six unit transactions were recorded in the broader three-month volume data and five had usable prices for the median calculation.

Monthly unit figures therefore need to be read cautiously. Several months in the 12-month analysis contain only one to three qualifying sales, so individual results can move the median sharply.

That is particularly clear in July, when the recorded unit median reached $1.1457 million from just three qualifying transactions, before August produced a $755,000 median from a single transaction.

Who Has Been Active in Narangba?

The transaction dataset also shows several agents appearing more frequently than others during the period.

Gavin Lomas was attributed 15 sales, followed by Tyson Von Hoff with 13. The dataset attributed four to Leanne Kroes, three to Rebecca Blewitt, and two each to Michelle Wheeler and Ryan Suhle.

Those figures are best read as activity recorded within the analysed dataset rather than a definitive market-share ranking. Not every transaction carries complete agent information, and the figures do not necessarily capture every agent active in Narangba.

Taken together, the latest numbers point to a Narangba house market now operating around the million-dollar mark. Monthly medians will continue to move with the mix of properties sold, but the broader measures are more telling: the three-month house median stands at $1.045 million, while the PMO’s 12-month median has also moved just above $1 million.

Read the full Property Market Overview here.

Published 8-September-2026

This overview is based on property transaction data available for the periods stated above. It is provided for general information only and should not be relied on as financial, investment, legal or real estate advice. Market conditions can change, and readers should undertake their own research before making property decisions.
Deception Bay and Rothwell Property Markets Show a Clear Price Divide

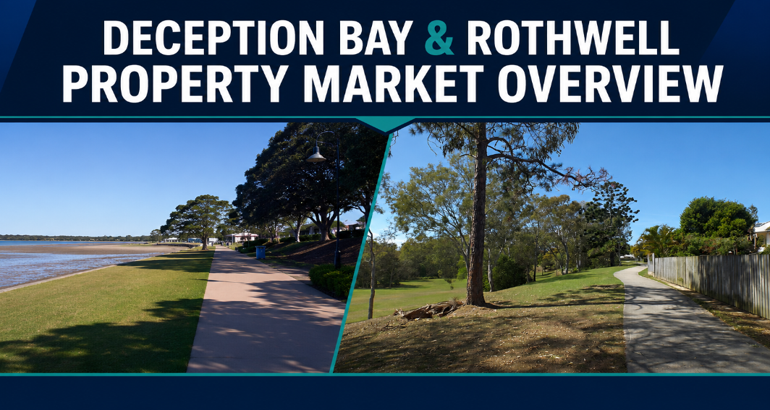
Rothwell recorded a median house price above $1 million over the latest three-month period, while neighbouring Deception Bay remained the higher-volume market with considerably more properties changing hands.

Property sales data for the three months to 14 August 2026 shows a marked difference between the neighbouring Moreton Bay suburbs, both in price and the number of transactions.

Rothwell recorded a three-month house median of $1.015 million, compared with its 12-month median of $986,500. The shorter-term figure was 2.9 per cent above the longer-term benchmark.

Deception Bay recorded a three-month house median of $860,000, compared with $870,000 across the trailing 12 months — a difference of about 1.1 per cent.

But while Rothwell recorded the higher median, Deception Bay was by far the busier market.

At a Glance

Suburb 3-Month House
Median
12-Month House
Median
3-Month
Sales
Median Days
to Sell
Deception Bay $860,000 $870,000 95 25 days
Rothwell $1,015,000 $986,500 26 30 days

Deception Bay Records Higher Sales Activity

There were 95 sales recorded in Deception Bay during the three-month period, compared with 26 in Rothwell.

Deception Bay’s underlying figures included 65 house sales and 29 unit sales, along with one other transaction. The dataset also contained nine undisclosed transactions, while three commercial rows were excluded from the residential analysis.

Rothwell recorded 18 house sales, three unit sales and two land transactions, with another three transactions undisclosed.

The longer-term house datasets also underline the difference in market size. There were 275 confirmed Deception Bay house sales across the trailing 12 months, compared with 79 in Rothwell.

Monthly Median House Price — Trailing 12 Months

Deception Bay monthly median house price and sales volume — trailing 12 months.

Rothwell’s Four-Bedroom Median Tops $1 Million

The bedroom breakdown provides a clearer picture of where the price gap between the suburbs sits.

Four-bedroom houses in Rothwell recorded a three-month median of $1.03 million from 15 sales. The corresponding Deception Bay median was $925,000 from 11 sales.

Three-bedroom houses were closer.

Deception Bay recorded a three-bedroom median of $837,500 from 44 sales during the latest three months, while Rothwell’s three-bedroom median was $870,000 from three transactions.

The smaller Rothwell sample means its three-month three-bedroom result should be treated cautiously.

Deception Bay’s highest three-month bedroom median was $1.1 million for five-bedroom houses, based on six sales. Its two-bedroom median reached $1.03 million, although that figure was based on only three transactions.

Monthly Median House Price — Trailing 12 Months

Rothwell monthly median house price and sales volume — trailing 12 months.

Top Sales Reach $1.48 Million

At the upper end of the Deception Bay market, 10 Barbados Boulevard recorded the highest confirmed residential sale in the overview at $1.48 million.

It was followed by 1/23 Denise Street at $1.355 million and 68 Shayne Avenue at $1.21 million.

Two commercial-scale Deception Bay records were excluded from the residential Top 10 because they were not considered representative of the residential market. A $1.3 million sale involving a block of units at 42-44 Balmoral Place was also excluded from the residential ranking.

Rothwell’s highest confirmed sale was 57 Tranquility Drive at $1.355 million, followed by 3 Allister Crescent at $1.19 million and 34 Dobell Street at $1.15 million.

Homes Taking Longer to Sell

One measure moved in the same direction in both suburbs: selling times.

Deception Bay’s median days to sell was 25 days during the three-month period, compared with 16 days across the trailing 12 months.

Rothwell recorded a three-month median of 30 days, double its 12-month figure of 15 days.

The figures provide a snapshot rather than a forecast. Short-term medians can move significantly depending on the number, size and type of homes sold during a particular period, especially in smaller markets such as Rothwell.

For buyers and homeowners comparing the neighbouring suburbs, the latest data shows a distinct market split: Rothwell recorded the higher three-month house median, while Deception Bay generated substantially more sales activity.

Read the full Property Market Overview here.

DISCLAIMER Published 16-August-2026

This overview is intended as a general market summary only and is provided for informational purposes. Nothing on this page constitutes financial, investment, legal or real estate advice. All figures, medians, rankings, and market observations are indicative only and should not be relied upon as complete or definitive. Property markets are dynamic and conditions can change rapidly — past performance is not a reliable indicator of future results. Readers should conduct their own independent research and seek qualified professional advice before making any property decision.

This overview is based on publicly available property transaction data for the periods stated in the above sections. All data is presented in aggregated and derived form. All dates are settlement dates. Where prices are unavailable, those transactions may be included in sales counts but are excluded from median and price band calculations. © 2026.