





Narangba House Prices Push Above $1 Million as Market Holds Firm

Narangba’s house market has pushed firmly into seven figures, with the latest three-month median reaching $1.045 million as sales through winter continued to cluster around the million-dollar mark.

The latest Narangba Property Market Overview, covering transaction data to 3 September 2026, puts the three-month house median about 3.9 per cent above the 12-month median of $1.0055 million.

There was also reasonable depth behind the latest snapshot. The dataset contains 80 house transactions over the three-month period, including 78 with usable prices for the median calculation, plus six unit transactions. That takes total residential transaction volume to 86.

Recent monthly results also show the suburb repeatedly trading around the million-dollar level rather than relying on a single strong month.

3-Month House Median

$1,045,000

+3.9% vs 12-month median

3-Month Unit Median

$815,000

0.0% vs 12-month median

3-Month Residential Volume

86 sales

80 houses + 6 units

Median Days to Sell

34 days

Houses; units recorded 28 days

House Market Settles Into Seven Figures

The monthly figures still move around, but the broader direction is clearer than any one result.

House medians were $950,000 in October 2025 and $980,000 in November before moving above $1 million in January 2026. The monthly median reached $1.1475 million in May, then eased to $1.035 million in June before returning to $1.055 million in July and $1.06 million in August.

September’s preliminary figure is lower at $949,000, but it needs to be treated with particular caution. The analysis only runs to 3 September and the figure is based on three qualifying sales, making it a partial-month observation rather than evidence of a broader market shift.

Narangba Houses — Monthly Median Price

The three-month median smooths some of that month-to-month movement and leaves Narangba at $1.045 million.

Selling times have also lengthened in the latest period. Within the PMO dataset, the three-month median for houses was 34 days, compared with 14 days across the 12-month analysis.

Four-Bedroom Homes Dominate Narangba Sales

The make-up of recent sales helps show where most of the activity has been concentrated.

Among house transactions with usable bedroom information, four-bedroom homes accounted for 53 sales during the three-month period. There were another 10 five-bedroom sales and nine three-bedroom sales.

That makes four-bedroom homes clearly the most common configuration in the available bedroom data, which fits Narangba’s strong family-home profile without implying that every transaction falls into the same price bracket.

There was also activity at the upper end.

The highest-priced transaction recorded in the overview was 94 Bazeridge Drive at $2.06 million, a five-bedroom, two-bathroom house attributed in the dataset to Tyson Von Hoff.

It was followed by a $1.518 million transaction at 6 Feeder Street and a $1.46 million house sale at 1257 Oakey Flat Road. Three other houses in the Top 10 changed hands for $1.45 million or more.

A Much Smaller Unit Market

Narangba’s unit market is considerably thinner, which makes the figures more sensitive to individual transactions.

The three-month unit median was $815,000, exactly level with the 12-month median. However, only six unit transactions were recorded in the broader three-month volume data and five had usable prices for the median calculation.

Monthly unit figures therefore need to be read cautiously. Several months in the 12-month analysis contain only one to three qualifying sales, so individual results can move the median sharply.

That is particularly clear in July, when the recorded unit median reached $1.1457 million from just three qualifying transactions, before August produced a $755,000 median from a single transaction.

Who Has Been Active in Narangba?

The transaction dataset also shows several agents appearing more frequently than others during the period.

Gavin Lomas was attributed 15 sales, followed by Tyson Von Hoff with 13. The dataset attributed four to Leanne Kroes, three to Rebecca Blewitt, and two each to Michelle Wheeler and Ryan Suhle.

Those figures are best read as activity recorded within the analysed dataset rather than a definitive market-share ranking. Not every transaction carries complete agent information, and the figures do not necessarily capture every agent active in Narangba.

Taken together, the latest numbers point to a Narangba house market now operating around the million-dollar mark. Monthly medians will continue to move with the mix of properties sold, but the broader measures are more telling: the three-month house median stands at $1.045 million, while the PMO’s 12-month median has also moved just above $1 million.

Read the full Property Market Overview here.

Published 8-September-2026

This overview is based on property transaction data available for the periods stated above. It is provided for general information only and should not be relied on as financial, investment, legal or real estate advice. Market conditions can change, and readers should undertake their own research before making property decisions.
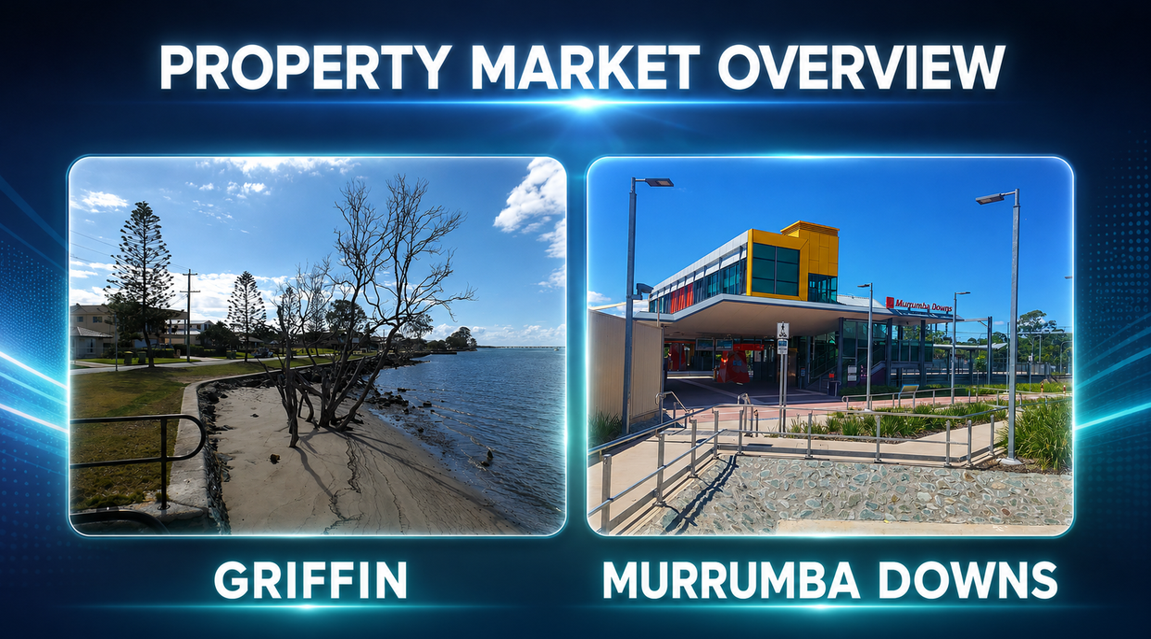
Murrumba Downs Houses Command a Premium as Griffin Units Push Higher

Griffin and Murrumba Downs share a postcode and the same fast-growing corner of Moreton Bay, but the latest property figures show buyers are paying noticeably different prices depending on both the suburb and the type of home.

Murrumba Downs recorded a three-month house median of $1.165 million for settled sales to 28 August, putting it $174,000 ahead of Griffin at $991,000. Yet the comparison reverses for units, where Griffin’s $810,000 median was higher than Murrumba Downs’ $772,000.

Those differences have emerged in an area transformed by housing and population growth. Griffin’s population climbed from 6,839 in 2016 to 12,295 in 2021 — almost 80 per cent in five years — while Murrumba Downs gained a station with the opening of the Redcliffe Peninsula Line in 2016. The Bruce Highway corridor through the two suburbs is now undergoing another major upgrade.

At a Glance

Latest three-month residential property snapshot

Market Measure
Griffin
Murrumba Downs
House Median
$991,000
$1.165m
vs 12-Month Median
−0.6%
+2.9%
Unit Median
$810,000
$772,000
vs 12-Month Median
+3.2%
−0.2%
Residential Transactions
56
51

Three-month figures cover settled residential transactions to 28 August 2026. Percentage movements compare the three-month median with the corresponding 12-month median.

The Premium Extends Beyond the Median

Murrumba Downs’ stronger house result also shows up at the top of the market. Its two biggest recorded sales for the period were 20 Tavistock Crescent at $1.86 million and 7 Hawkhurst Court at $1,850,222, while every property in its Top 10 reached at least $1.3 million.

Griffin topped out at $1.35 million for 13 Sepia Place, followed by 8 Bronze Court at $1.31 million and 10 River Breeze Drive at $1.3 million.

Over the latest three months, Murrumba Downs’ house median was about 2.9 per cent above its 12-month figure of $1.132 million. Griffin’s $991,000 median was about 0.6 per cent below its longer-term figure of $997,000.

Murrumba Downs Property Snapshot

House Median

$1.165m

3 months • +2.9% vs 12-month median

House Sales

33

Total transactions • 3 months

Unit Median

$772,000

3 months • −0.2% vs 12-month median

Unit Sales

18

Total transactions • 3 months

Griffin Units Turn the Comparison Around

Griffin’s unit result is notable in a suburb dominated by houses and townhouses. At the 2021 Census, 72.2 per cent of occupied dwellings were separate houses and another 26.7 per cent were semi-detached homes, terraces, row houses or townhouses. Flats and apartments accounted for just 0.9 per cent.

Against that housing mix, the $810,000 three-month unit median was 3.2 per cent above Griffin’s 12-month figure of $785,000. Murrumba Downs’ $772,000 unit median was almost unchanged from its longer-term $773,500 figure.

The samples are smaller than for houses, particularly in Griffin, so the short-term movement warrants some caution.

Griffin Property Snapshot

House Median

$991,000

3 months • −0.6% vs 12-month median

House Sales

47

Total transactions • 3 months

Unit Median

$810,000

3 months • +3.2% vs 12-month median

Unit Sales

9

Total transactions • 3 months

Four-Bedroom Homes Still Rule

The sales mix reinforces just how strongly this part of Moreton Bay is geared towards family housing. Of the 44 Griffin house transactions with usable bedroom information, 37 were four-bedroom properties; Murrumba Downs recorded 20 four-bedroom sales, seven five-bedroom sales and one six-bedroom sale.

That pattern is not confined to the latest quarter. At the 2021 Census, 57.6 per cent of occupied dwellings across the combined Murrumba Downs-Griffin area had four or more bedrooms, compared with 38.8 per cent across Queensland.

Monthly Medians Have Been Bumpy

The three-month medians smooth over considerable movement underneath. Griffin’s monthly house median reached $1.073 million in June, before coming back to $983,500 in July and $945,000 in August, while Murrumba Downs went from $1.275 million in June to $1.065 million in July and $1.082 million in August.

Those movements should not be read as houses gaining or losing those amounts from month to month. The properties settling each month change, and some monthly medians are drawn from relatively small samples, making the transaction volumes shown alongside the price series important context.

Monthly Median Price Trends

Monthly median sale prices are shown alongside the number of transactions included in each monthly median.

Griffin — Houses

Monthly median sale price and qualifying transactions

Median price Transactions

Griffin — Units

Monthly median sale price and qualifying transactions

Median price Transactions

Murrumba Downs — Houses

Monthly median sale price and qualifying transactions

Median price Transactions

Murrumba Downs — Units

Monthly median sale price and qualifying transactions

Median price Transactions

Monthly medians can fluctuate where transaction volumes are low. Griffin’s house series begins in October 2025 because no qualifying September 2025 monthly median is plotted in the analysed dataset.

Similar Turnover, Different Mix

There was little separating the suburbs on overall activity, with 56 residential transactions in Griffin and 51 in Murrumba Downs during the three-month period. The composition was quite different: Griffin recorded 47 house and nine unit transactions, against 33 houses and 18 units in Murrumba Downs.

Growth Has Changed Both Suburbs

The combined Murrumba Downs-Griffin area grew from 17,520 residents in 2016 to 23,089 in 2021, an increase of almost 32 per cent in five years. That expansion has occurred alongside major changes to the transport network, including the opening of the Redcliffe Peninsula Line in 2016.

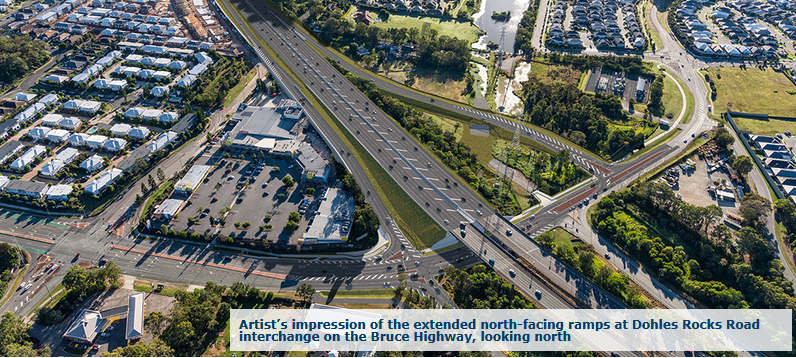
Photo Credit: Dept of Transport and Main Roads

Another change is already under way. Stage 1 of the Bruce Highway upgrade between Dohles Rocks Road and Anzac Avenue runs through Griffin and Murrumba Downs, with main construction beginning in April 2025. The project includes extended north-facing ramps, with improved capacity, traffic flow and road access among its intended benefits.

Infrastructure and population growth cannot explain the movement of a three-month property median on their own, but they provide useful context for a part of Moreton Bay that has changed substantially over the past decade.

Same Postcode, Different Property Markets

The latest figures leave Murrumba Downs with a clear premium for houses and a stronger showing among high-value sales, while Griffin recorded slightly more transactions and the higher unit median.

For owners and buyers, the distinction matters: in 4503, the type of property changing hands can be just as important as which side of the suburb boundary it sits on.

Published 31-August-2026. Disclaimer: This article provides general property market information only and should not be considered financial, investment or property advice. Market figures are based on transaction data available for the periods stated and may be affected by the number and mix of properties sold. Readers should conduct their own research and seek appropriate professional advice before making property decisions.